At SPS Commerce we are moving all our APIs into Kubernetes. There are many reasons for this change, but one of the more fun reasons is the ability to use a tool like Jaeger. Jaeger is a distributed tracing tool, useful for seeing how your APIs and services all work together to process one request.
A lot of the initial setup of this infrastructure was performed by our wonderful SRE team. As an application team that maintains a Django REST Framework application, there wasn’t a lot of additional work required to start seeing the advantages of tracing. We added and configured the OpenTelemetry Django, Requests, and Psychopg2 instrumentors to generate spans representing different operations within our application. These instrumentors capture interactions between our application and its dependencies, and they plug into the application with very little changes or configuration required. Then we configured a Zipkins exporter to send those spans to our platform’s shared collector.
After opening the Jaeger UI and filtering down to only traces including our application, we started browsing through the traces, just exploring the tool. Very quickly a few endpoints began to stand out due to their high response times and high number of spans required to complete a single request. Here is an example trace of one of the problematic endpoints, drilled down into the database spans:
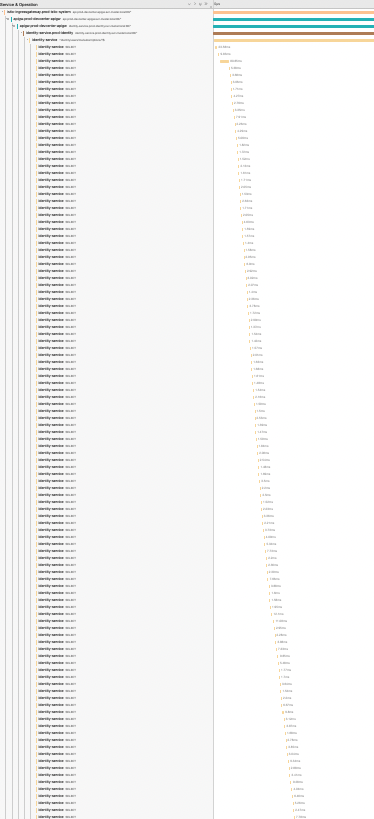
This is a complicated endpoint, joining together data from multiple tables, but no endpoint should be making this many calls to the database to generate a single response. As most Django developers have likely found out: inefficient use of the Django ORM can have catastrophic effects. A brief investigation uncovered code that iterated through a queryset, and for each entry in the queryset it made an individual call to the database to retrieve a different object. Then to make matters worse, those objects were then passed to a serializer that included a nested serializer for one of their related objects! The result was for users who had associations with many of these objects, or with objects that were particularly complex or nested, a single call to this endpoint could generate more than one hundred calls to the database!
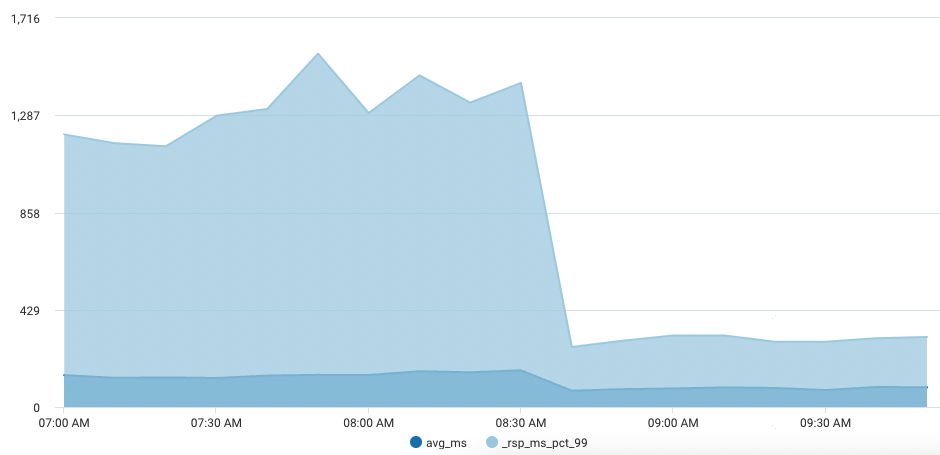
By using the very helpful django_assert_num_queries pytest fixture, we were able to write a test that measured the number of queries this endpoint made and could easily reproduce the issue. After some simple refactoring and a well-placed call to prefetch_related_objects(), we were able to reduce that endpoint down to a manageable handful of queries. The drop in response times after we deployed the fix pretty clearly reflect the improvement:
We have only just begun to scratch the surface of what we can do with Jaeger. But already, the introspection and visibility it provides have been incredibly helpful. As more and more of our APIs migrate onto our Kuberenetes platform, the benefits will only grow.