If you have or plan on doing anything constructive with your log output from a default ASP.NET Core Web Application you have probably come quickly to the conclusion that the default logging leaves a lot to be desired. Just take a look at it:
Request starting HTTP/1.1 GET [test.com/v1/Test/C...](http://test.com/v1/Test/CheckConnectivity)
Executing endpoint 'Test.Web.api.v1.TestController.CheckConnectivity (TestApi.Web)'
Route matched with {action = "CheckConnectivity", controller = "Test"}.
Executing controller action with signature System.Threading.Tasks.Task1Microsoft.AspNetCore.Mvc.
ActionResult1TestApi.Web.api.v1.models.Test.CheckConnectivityResponse
CheckConnectivity(TestApi.Web.api.v1.models.Test.CheckConnectivityRequest)
on controller Testpi.Web.api.v1.TestController (TestApi.Web).
Checking the connectivity for the 'BLUE' database using the 'BLUE' thingy.
Request finished in 4.5672ms 200 application/json;charset=utf-8
Request finished in 3.8104ms 200 application/json;charset=utf-8
Request finished in 3.6904ms 200 application/json;charset=utf-8
The output as a whole tells me a lot of the useful bits I need to get started creating dashboards or pulling audit information from it… but the logs are all individually output with little context between them making this a difficult task (if not impossible) with a lot of log parsing tools out there.
For example, it is great that I have a nice simple “Request starting” line with the verb and the path. I can begin to map a lot of my usage with that. You will quickly get frustrated though while attempting to relate this entry point to the result of the request. Was the request successful (200? 500?)? What was the duration of that request? If you were able to correlate multiple independent log lines together somehow (feels like a regex lookahead lookback kind of approach), how would you know which of the final three “Request finished” lines matches your request? After all, this API can process more than a single request in parallel at any given time (I hope).
Additionally, this framework provides us no standard way with ILogger dependency injection in .NET Core to easily add more context to any existing output. All we can do is add yet another logline that is not correlated in any way. Standard output information like trace-identifiers would go a long way in helping us at least match the logs together.
My final key gripe would be that the structure of the logs is incredibly inconsistent. While a JSON log format may be more verbose in some regards, structured logs go a long way in making a lot of these problems go away.
Serilog to the Rescue!
Serilog seems to have become the defacto standard for .NET Core logging overnight (from my perspective, it became popular very quickly). It is refreshingly simple compared to other frameworks I have used in the past, like log4net, yet has most of the features I need.
Serilog enables you to entirely customize your log format and mix structured JSON logs with non-structured if you so desire, or go entirely custom. It is pluggable with different “sinks” to write logs to many destinations. It includes a package and templates to quickly get started hooking into the middleware pipeline for ASP.NET Core. The programmatic configuration is fluent and almost self-documenting:
Log.Logger = new LoggerConfiguration()
            .MinimumLevel.Debug()
            .MinimumLevel.Override("Microsoft", LogEventLevel.Information)
            .Enrich.FromLogContext()
            .WriteTo.Console()
            .CreateLogger();
We can now easily configure Serilog to output structured JSON logs with full ASP.NET Core Context in a single line:
{
    "@t": "2019-06-26T06:05:54.6881162Z",
    "@mt": "HTTP {RequestMethod} {RequestPath} responded {StatusCode} in {Elapsed:0.0000} ms",
    "@r": ["224.5185"],
    "RequestMethod": "GET",
    "RequestPath": "/",
    "StatusCode": 200,
    "Elapsed": 224.5185,
    "RequestId": "0HLNPVG1HI42T:00000001",
    "CorrelationId": null,
    "ConnectionId": "0HLNPVG1HI42T"
}
Note, I’m not attempting to provide an explicit guide on how to set up and configure Serilog for this, but rather pass you to some already great documentation on that: - Official Documentation to get Setup: https://github.com/serilog/serilog-aspnetcore - Andrew Lock provides an in-depth multi-series post on all the basics and pitfalls [Highly Recommended Read]: andrewlock.net/using-ser…
The problem in the above posts is that they make the assumption that you are using “Seq” as a logging tool. Seq looks fantastic but it is relying on the Sink for Seq integration to transmit all my logging context and properties without it being in the raw STD output logline. This simply won’t work for those of us with different logging patterns and tools.
Logging All JSON Properties
With a bit of work we can modify the typical setups above to just log ALL properties into the structured JSON format by adding customizations to the output template:
new LoggerConfiguration()
  .WriteTo.Console(
    outputTemplate: “[{Timestamp:HH:mm:ss} {Level:u3}] {Properties:j}”);
Specifying the “{Properties}” syntax will display all properties that have not yet been used in the template (neat!). The “j” modifier on it enforces strict JSON formatting for quotes on property keys.
If I wanted to combine some structured and non-structured log output into the same line I can do that (doing so makes sense in some cases for readability/scanning, etc):
new LoggingConfiguration()
  .WriteTo.Console(
    outputTemplate: “[{Timestamp:HH:mm:ss} {Level:u3}] {Message:lj} {Properties:j} {Exception}{NewLine}”);
By default, because I am already including Message and Exception in the log template, those properties will not show up in the structured JSON output of properties, which now looks like this:
[17:37:16 INF] HTTP GET /v1/test-endpoint responded 200 in 2244.1469 ms
{
  "Host": "test.com",
  "Protocol": "HTTP/1.1",
  "Scheme": "http",
  "MachineName": "bdf9396sdfebd9",
  "ContentType": "application/json; charset=utf-8",
  "TraceId": "1-6e8622ca-4979bag678251a50f53c0966",
  "Username": "Travis",
  "IdentityId": "12",
  "AppVersion": "2.0.113.0",
  "SourceContext": "Serilog.AspNetCore.RequestLoggingMiddleware"
}
Now you can quickly format your log output, structured or non-structured, to whatever works best for the tooling you use. Exciting!
Log Volumes
As a small aside to the discussion, we are now pushing more data to the logs because the Property context is provided on all output lines. That does make it more usable for sure, but likely increases your storage cost at least a little.
That being said, while it increases overall size, the number or volume of logs is significantly reduced since we are keeping more in a single line per incoming HTTP Request. Here is a view of the log count reduction we saw in most services the pattern was applied to:
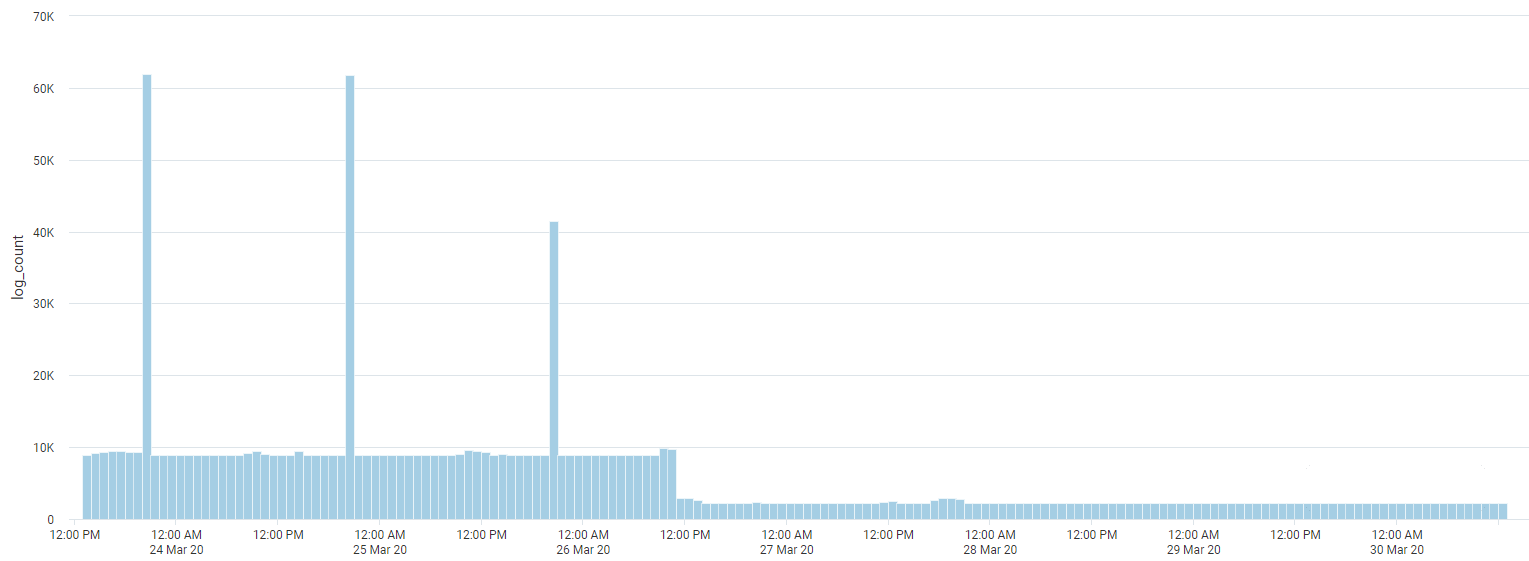
In the center, you’ll be able to easily see where the new logging pattern came into play.
Parsing Structured JSON in SumoLogic
In the case above, I have simply formatted the console output and have not used a specific Sink for my tooling provider. I generally worry that having my application batch up logs and send via HTTP from inside the container to my chosen log provider may not be where I want to spend resources. A lot of cloud infrastructure allows you to easily pipe STD output directly to native service. For example, running ECS or Lambda or other AWS Service pushing output to CloudWatch Logs. From that interim provider, I can subscribe to the logs and push to any number of logging providers. In this discussion, we are pushing to SumoLogic.
I totally could have used this Sink for SumoLogic but didn’t want that added complexity or coupling as mentioned above. After getting my SumoLogic logs into a source category, I can now easily parse it as JSON and query from it:
_sourceCategory=your_category
 | json auto
 | Host
JSON Auto command is awesome! It automatically takes the log and looks to parse all JSON it can find in it and provide the keys back for you to consume. In this case, I can now use “Host” because it parsed out of our JSON Properties automatically.
I can combine JSON auto-detection with specific fields from general SumoLogic parsing as follows:
_sourceCategory=your_category
 | parse "[* *] HTTP * * responded * in * ms *" as time,type,verb,path,status,durationMs,context
 | json auto field=context
 | Host
Now it will only attempt to look for JSON inside the “context” portion of the log (a small performance benefit).
With the new context and structured log output, it is pretty easy to build some high-quality dashboards. This is an example from SumoLogic:
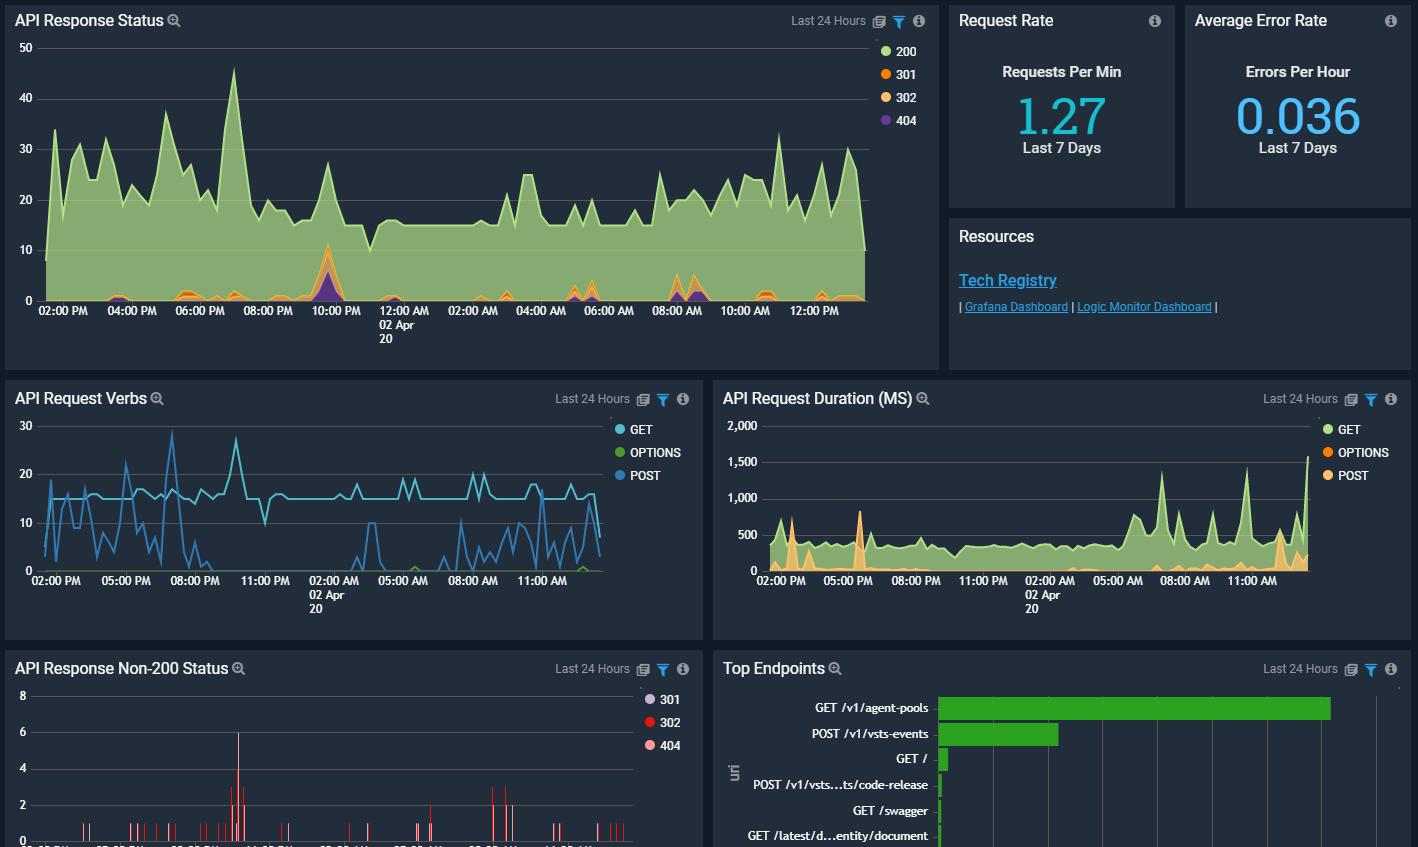
To take it one step further, in SumoLogic, we have created reuseable dashboards that you can simply modify or select the sourceCategory and easily bring up a dashboard for anyone using this logging format - something we are beginning to standardize across many of our .NET Core APIs.
Reference: http://blog.travisgosselin.com/asp-net-core…
